Posts

NCQA PCMH REDESIGN

By Julie Wood MSc. PCMH CCEPCS_logo_VG
Co-Founder, Patient Centered Solutions LLC

The NCQA is in the process of redesigning not only the initial Patient Centered Medical Home recognition process, but also the renewal process for already recognized practices. The redesigned initial recognition process will be part of the 2017 update to the PCMH Standards, and the updated renewal process is part of a major, ongoing redesign intended to streamline the application.

The current NCQA PCMH Recognition process is highly labor intensive for all involved. The process can take anywhere from six months to two years to complete (depending upon your practice size and number of locations), adding up to a significant investment of your practices resources.

In addition to the sheer amount of work involved, the NCQA application process isn’t an easy one to navigate. For example, there are three different places online where you have to go at various stages during the application:

  1. You’ll first log in to obtain your Standards and to buy the ISS Survey Tool. For this you will need to have a Username and Password for the NCQA Online Store.
  2. Then you’ll need a separate Username and Password for the Application portal where you will complete and submit your application.
  3. Lastly, in order to add documentation to the ISS Survey Tool for submission to the NCQA for grading you’ll need another separate Username and Password.

To make matters more complicated, you can’t pay online right now either—payments are only accepted by phone, fax or check.

In order to address some of this complication, in the spring of this year NCQA started a forum called Ideas4PCMH on their website. Representatives from small and large practices, professional societies, health plans, hospitals, accountable care organizations, community health centers, health IT companies, PCMH Certified Content Experts (CCEs), and State-based agencies gathered to form 17 focus groups tasked with developing new ideas for the redesign of their program logistics.

The PCMH redesign strategy includes four major components:

  1. Provide more guidance to practices through new channels, including live support, online resources and improved customer service;
  2. Introduce a streamlined annual check-in for recognized practices rather than requiring a full documentation review every three years;
  3. Use information generated in the course of daily clinical care to support the recognition process; and,
  4. Redesign the online survey tool to be more user-friendly and efficient.

In the current (2014 Standards) submission process they have already streamlined a few things. For example, the time-consuming process of entering percentages into a box in the ISS survey tool is no longer required for any of the meaningful use reports or the Record Review Workbook.

Under the 2011 Standards NCQA introduced ‘pre-validation’ for EHR’s and Practice Management Systems. Despite streamlining, the work required to get credit for pre-validated points after you have achieved recognition requires the equivalent of an add-on survey. For those of you going through the process now, check with your EMR vendors and if a product was pre-validated under the 2011 Standards, NCQA has cross-walked some of those points to the 2014 Standards. I will add a note of gratitude to the IT companies that do complete the pre-validation process—it is costly and time-consuming for them to do so—making it that much easier for practices submitting to the NCQA with these systems in place, and for us here at The Verden Group/PCS when guiding our clients through the process. Under the 2011 Standards some Vendors had as many as 17-21 points towards the 85 you need for a Level 3 Recognition—a really great step in the right direction.

However, while they help streamline some processes, there is also more work involved under the 2014 Standards than any standards that have come before. There is a requirement to provide annual patient satisfaction results and clinical performance data to them once you have your 2014 Recognition. This is to make sure that practices truly are continuing on the PCMH path and not just submitting (and then promptly dropping!) all of the good practices put in to place through the transition process.

One really exciting step in the right direction is that the NCQA has engaged a digital agency with unique expertise in user experience to help design their new online submission platform. During the next three to five months, the agency will talk to focus groups, participate in internal discussions, and review submitted comments. At the end of this first phase of development, the agency will present a design concept for the online platform that supports the updated PCMH recognition process. Their goal is to approve the final design concept later this year with the intent to build and test it in 2016.

The NCQA states, “We all have the same goal—improving the care people receive, their experiences with health care, and the need to reduce costs.” With regard to this statement, I believe that while the current NCQA PCMH model has introduced many benefits to practices and patient care, it is also true that the time and resources this process takes within a practice is enormous. Every practice that we have taken through the NCQA Recognition process has seen the benefits to documenting processes and overall streamlining of care. No one can argue that the system isn’t improved when you close all of the loops where patients can get lost in the cracks, but the resources it takes to do so cannot be ignored.

Also, having taken practices through the renewal process, I am keenly aware that even though you only have to provide documentation for 11 of the 26 Elements, you had better make sure that you are ready and able to provide documentation for the other 15 Elements as they can come back and ask for it at anytime. Generally, they will allow 3 days to provide the information but we’ve seen some cases where the practice has only been given 24 hours to produce documentation (we appeal those requests, of course!).

Here at the Verden Group/Patient Centered Solutions we are sincerely hoping for a sensible and simplified result from this major redesign.

We encourage you to participate in this discussion by sharing your opinions and ideas with the NCQA at: [email protected]

*A Tip for Practices Recognized under 2014 Standards: Under your quality improvement project, change your clinical measures to new ones once you have reached your goal – continuing at 100% would not be acceptable to NCQA 3 years in a row. They expect to see continuous improvement, not improvements achieved and then simply maintained at that target level. So set your goals small in order that they are both easily achievable and allow for incremental upward progression over the course of the three-year period.

PCPCC Reports Positive Outcomes of PCMH Initiatives

By Jose Lopez, Senior Consultant, The Verden Group

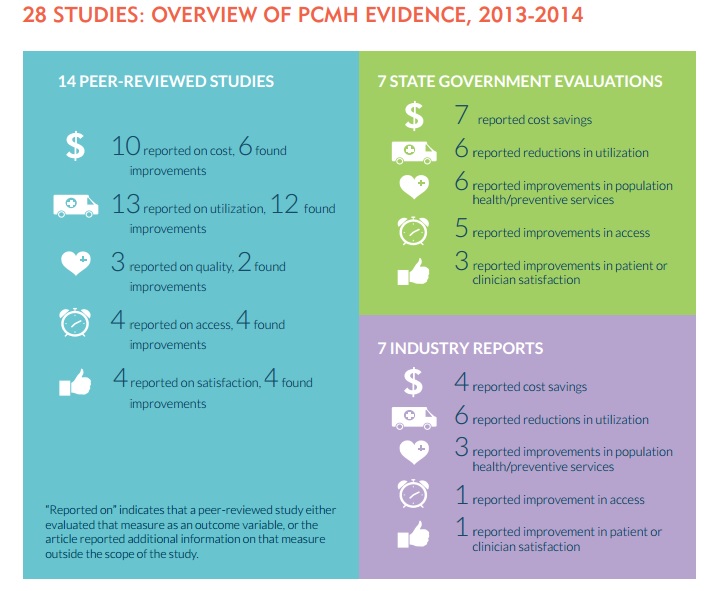
The Patient-Centered Primary Care Collaborative (PCPCC) recently released The Patient-Centered Medical Home’s Impact on Cost and Quality: Review of Evidence 2013-2014. The report highlights evidence from primary care Patient-Centered Medical Home (PCMH) initiatives taking place in both public and private markets across the country. The report looks at selected outcomes from 28 peer-reviewed studies, state government evaluations, and industry reports published between September 2013 and November 2014. The results are encouraging and demonstrate the PCMH’s positive impact on reducing cost and unnecessary health care utilization.

Summary of Overview: Of the 14 peer-reviewed scholarly publications, 60% of studies reported reductions in cost and 92% of studies reported improvements in utilization. Of the 7 state government reports, 100% reported reductions in cost and 86% reported improvements in utilization Of the 7 industry reports, 57% reported reductions in cost and 86% reported improvements in utilization. Summary of Overview: Of the 14 peer-reviewed scholarly publications, 60% of studies reported reductions in cost and 92% of studies reported improvements in utilization. Of the 7 state government reports, 100% reported reductions in cost and 86% reported improvements in utilization Of the 7 industry reports, 57% reported reductions in cost and 86% reported improvements in utilization.[/caption]

The report concludes key areas integral to the future development of enhanced primary care and the PCMH including: integration into medical neighborhoods and accountable care organizations; financial support for primary care; consumer and public engagement; development of team-based health professions; and the role of technology in the PCMH and primary care.

The Verden Group’s Patient Centered Solutions is focused not just on helping clients achieve NCQA Patient Centered Medical Home (PCMH) and Patient Centered Specialty Practice (PCSP) recognition, we also deliver solutions to help you meet your patient education needs, help you reach pay-for-performance targets, and improve the patient experience at your practice.

We work with each client individually to determine where your practice stands today and identify the work to be done to help you meet your goals. We’ll put a project plan in place, keep you on track, and get you to the finish line.

Single site or multiple sites, primary care or multi-specialty, we help you to navigate the process from application through submission. For more information visit: www.theverdengroup.com/our-services/patient-centered-solutions-services/

Improve Your Bottom Line

by Susanne Madden [published in Physician’s Practice PEARLS newsletter]

Whenever possible, you should negotiate with your payers for better contract terms and payment rates. However, in this economic climate negotiations are becoming tougher and many payers are refusing negotiation requests outright.

So what can you do? Consider adjusting your payer mix to create optimum value. That means evaluating your payers to determine your participation costs, as well as your reimbursement rates. Once you figure out which payers are good and which are bad, you can put a plan in place to allow you to reduce the percentage of visits for the high-cost, lower-paying plans, and grow your business in low-cost, higher-paying plans instead.

The simplest way to evaluate cost and payment is by doing a quick “litmus test” to look at your effort vs. reward ratio. This requires only six simple steps:

1. Pick a time frame to measure, preferably one at least three months in the past to allow for most claims in that period to have been paid.

2. Total all of the revenues received from all your payers during that period, breaking out the revenue received from each payer.

3. Total the number of procedures (or visits, if you prefer) performed in that period and then break down that number by payer.

4. Divide each payer’s revenue by the total revenue to determine the percentage received for services rendered to that plan’s members in that time period.

5. Divide the number of procedures for each payer by the total number of procedures to calculate the percentage of “effort” rendered to each payer’s members.

6. Compare the percentage of revenues for each payer to its corresponding percentage of effort. The higher the percentage of revenue compared to the percentage of effort, the better. Equal ratios, for example, 14 percent of effort and 14 percent of revenue, mean you are getting out only what you put in, with little margin. Where the revenue ratio is less than the effort ratio, it indicates very poor performance indeed.

Looking at your numbers this way helps to identify problem payers quickly. It is a good way to measure both payment and cost together — that is, slow payers and payers who routinely don’t pay procedures or have a high denial rate will be the ones that stand out in this brief analysis. However, it is only a quick and easy method to begin quantifying your payers and should only be used as such.

To really understand a plan’s performance drivers, you should compare specific rates for specific codes across your payers, as well as analyze participation costs for each individual payer; for example, the amount of time spent following up on claims, the denial rate, the resubmission rate, and so forth.

The next step is to put a plan together that will allow you to minimize the bad and optimize the good. Participating with only those plans that offer reasonable rates and have reasonable costs will ensure that your payer mix is blended for optimal value.

Humana gets political

Federal lawmakers recently urged CMS to investigate a letter sent by Humana Inc. to its Medicare Advantage members. Humana’s undated letter states: “Leading health reform proposals being considered in Washington, D.C., this summer include billions in Medicare Advantage funding cuts, as well as spending reductions to original Medicare and Medicaid. While these programs need to be made more efficient, if the proposed funding cut levels become law, millions of seniors and disabled individuals could lose many of the important benefits and services that make Medicare Advantage health plans so valuable.” The one-page letter is signed by Humana Medicare’s chief medical officer, Philip Painter, M.D.

Scare tactics? I’ll say!

CMS has demanded the company “immediately” stop member mailings warning that reform legislation could hurt them, and to remove any related materials from its Web site.

But CMS did not stop at Humana. It has issued the warning to cover the entire MA industry effective Sept. 21. The agency issued new guidance to MA and Part D plans to “suspend potentially misleading mailings to beneficiaries about health care and insurance reform.” AHIP has responded that seniors “have a right to know how the current reform proposals will affect the coverage they currently like and rely on.” It’s just a pity Humana decided to frame the communication to scare seniors rather than enlighten them.

But the real kicker is that Humana’s letter urged its enrollees to contact their members of Congress to protest healthcare reform. Isn’t it bad enough insurers are spending roughly $1.4 million a day on lobbying efforts in Washington to kill reform without also lobbying its members directly using shoddy ‘facts’? Where do we draw the line and say enough is enough? The numbers don’t lie. Let’s stick with the facts. Insurers are making huge profits at a time when many Americans cannot afford the product they sell. In not other industry would such mis-economics continue to survive, let alone thrive.

Luckily, CMS marketing rules require that member communications to meet certain requirements and the use and disclosure of protected health information to contact members to get them to lobby for or against certain reform legislation appears to be something that HIPAA rules do not allow. At the least, Humana will be facing fines and perhaps suspension from MA activities for a while.

However, that does not compensate for the misinformation. Unless Humana is required to send a notification to those same members informing them of its wrong-doing, it has accomplished its goal and moved real reform further out of reach.  How big a blow has a simple letter like this dealt to progression? As of the end of the second quarter, Humana had 1.5 million MA enrollees, all of whom may have recieved this letter. . .

The Cost of Healthcare, Quantified (Maybe)

The other day I read a RWJF report entitled “High and rising health care costs: Demystifying U.S. health care spending” over at http://www.healthpopuli.com/ after a fellow listserve member directed our attention to it. The report basically points out that rising malpractice rates aren’t one of the primary reasons for the increase in healthcare costs in the US, a seemingly popular belief. Instead it’s “…prices, inefficiency, and insurance administration.”  Finally we are getting somewhere close to pinpoining the real drivers, I thought. Then I read the report.

There is very good analysis in here, but it is disappointing to note that while they were identified, administrative costs were not more intensively examined. The authors do state that much of the differences we see between the US and OECD countries comes down to the lack of a universal delivery system, creating a costly fragmented system here. But the level of detail in the analysis seems to stop there.

For example, when comparing physician compensation, the findings state that in the US it is 6.6 times per capita GDP for specialists and 4.2 times for primary care, compared to 4 and 3.2, respectively. However, the authors don’t take that next step to note that in countries where there is universal care, physicians are (for the most part) salaried employees in some form or another. By contrast, the majority of physicians in the US own their own medical businesses, meaning that they are bearing the overhead and expense incurred in doing so. An analysis that factors that in would be more helpful than simply pointing at hard numbers. Without backing out those costs, we cannot know if physician compensation (I am defining compensation as the amount that physicians get to keep) is actually much higher than in OECD countries. Perhaps the authors are looking only at take-home pay, but that isn’t indicated [that said, I just looked up the McKinsey report upon which this is based, and McKinsey IS looking at TOTAL compensation, NOT take home pay – so I rest my case on that point]

The paper goes on to note that ‘MGI (McKinsey) estimated that the United States spends six times more for administration than OECD countries, not including the costs borne by providers in interacting with payers’. Why aren’t those costs included? If they were , the numbers would be much higher and help reveal that the cost of supporting the current private payer system is exorbitant. The authors get close to this idea in Table 1, Drivers of Cost Trend, where ‘changes in third party payment’ and ‘administrative costs’ are identified – when combined these two items account for 23%-26%, and that is without taking in to consideration ‘the costs borne by providers in interacting with payers’. What would the number be if those costs were included? In a study released by Ingenix recently, they state that ‘claims processing inefficiencies impose significant administrative costs on payers and providers, with estimates ranging from $210 billion to $250 billion annually’. Let’s say that again – $210-$250 BILLION, ANNUALLY! They further estimate that 14% of physician revenue is spent on claims activity; 12-24% of health plan revenue is spent on same. So why are the authors NOT including ‘the costs borne by providers in interacting with payers’ in either physician compensation or administrative spending?

Things get really fuzzy when the authors adopt the position of only looking at cost drivers from the perspective of analyzing what actually drives changes in the spending trend. In doing so, they arrive at conclusions such as ’standard assumptions about how a change in health insurance affects an individual’s spending on health care lead to a conclusion that health insurance is not a dominant driver of spending trends’. However counter-intuitive this might seem then, utilization is not a key cost driver; as this study examines, it is the cost per unit of utilization that best represents overall costs, and that per unit cost is composed of the key drivers identified in this study. But once the authors have made that claim, it shifts their commentary from being about end costs of delivery (the numbers initially referenced in the study) to shifting to utilization when it comes to discussing insurance. Therefore they fail to examine the end cost of securing that insurance, which ultimately is THE cost that needs to be examined because that cost includes the profit margins made by insurers, and the associated administrative costs to secure those profits in the process.

It would appear that by missing this point, the conclusions arrived at based on the numbers used are therefore somewhat skewed. That is, the authors are looking at such universal numbers as physician compensation as a percentage of GDP but without applying the cost associated in being a physician in the US system (a very different cost structure than in OECD countries); they are not looking at the cost of premiums as compared to what percentage of those premiums are actually SPENT on care delivery; and they are not examining the cost associated the fragmentation involved in the different middlemen associated with payment delivery. Notably, the section on managed care begins by stating ‘because of data limitations, most of the literature defined managed care as health maintenance organizations (HMOs), entities that play a much smaller role in health care financing today’ – so there is the realization that even the quantification of these entities is difficult,
and due to the identification and research on only perhaps one type of insurer it raises methodological concerns about the research itself. Perhaps because of the lack of comprehensive data on private insurance, the authors choose to make the following closing argument for improving efficiency – ‘payment mechanisms potentially more consistent with efficiency include a single per episode payment that goes to all providers involved in a major acute procedure and capitation payments to a medical practice for the management of patients’ chronic diseases’ – with no consideration about HOW such a single payment would be administered across multiple providers of care. To me, this simply sounds like another level of payment administration being added to the fragmented mix, and a costly one for providers at that.

Finally, at the end of the paper the authors address administrative costs. And yet, they do not scratch the surface here other than to simply note ‘a multipayer system can be made more efficient’ and suggest that more ‘administrative controls’ such as prior authorizations are being ‘re-introduced’ as a way to help with restraining spending. This leads me to believe that the authors have limited experience in the processes involved in administration and revenue cycle management. The opportunity to improve efficiencies in payer-provider interactions there is considerable; adding prior authorizations to procedures drives up physician costs, rather than simply limiting utilization is a way that is significant enough to minimize utilization. The argument cannot continue to be that insurers administrative burdens are a necessary cost in order to keep utilization down. Certainly these administrative burden HAVE resulted in less SPENDING by the insurers, but how much is based on decreasing utilization and how much is due to lack of payment by insurers for services rendered in the event that the rules are not adhered to is open to debate. Therefore, this does not translate to supporting administrative burden as a necessary cost.

To conclude, the authors state under ‘the need for additional information’ that their ‘understanding of high and rising costs is fairly solid. . . yet go on to say ‘paying multiple providers for acute episodes of care requires advances in patient classification and risk adjustment. Paying for medical homes similarly needs better risk-adjustment models and the gathering of data on resources that go into care coordination. To put it differently, existing research has given us a satisfactory understanding of the problem. Now the energies of researchers should be directed toward developing and implementing solutions’. I’m all for directing energies toward implementing solutions. However, I challenge that while the authors may have a reasonable understanding regarding spending, they have not adequately understood the single biggest COST driver of all: health care insurance companies. Until researchers adequately explore just how much cost is involved in allowing these organizations (that have an inherent conflict-of-interest) to set policies on payment, utilization, and provider cost burdens, we cannot move toward meaningful reform in that area. I back up this comment by pointing out that most insurers do not pay for nutritional counseling at the primary care level, do not pay for smoking cessation counseling, do not pay for pediatric counseling and developmental screenings – all of the things that may help to reduce illness in society (and therefore reduce costs). So how can the other lofty goals of improving health and wellness, focusing in on best practices, development of better guidelines, etc and so on, be implemented in a system where insurers have effectively killed primary care and preventive medicine?

I therefore call on the authors to re-examine their ‘fairly solid’ ‘understanding’ of high and rising costs. They, and other researchers, must take a much closer look at how insurers’ policy decisions have impacted the ability of providers of care to actually provide the lowest-cost, best-outcome focused care. With that level of scrutiny, comprehension about the impact of those policies can finally be assessed and the impact of private insurers on COST can accurately be quantified and thus called upon to improve.

It’s Going To Be A Bumpy Ride

In the face of membership declining by an estimated 800,000 for 2008, the Dow Jones Newswires reported Tuesday that United Healthcare is cutting operating costs, capital spending and headcount to focus on a more regional structure.  The headcount cuts are expected to be as high as 4,000. These cuts are due to be largely focused on IT and clinical operations. But wait – isn’t that where UHC’s core competencies lie, in IT and clinical operations? It certainly doesn’t lie with customer service and innovative provider partnerships.

For physicians, this could be good news, but only if it leads to more efficient processes as well. Less resources to manage high cost administrative tasks like referrals and preauthorizations could mean that United will soon modify those practices, thus alleviating some administrative burden (and cost) from providers. However, if its management history is anything to go by, that’s not likely to happen soon. This is further supported by decisions being made today – cut staff and you lose talent, at precisely a time when UHC needs to compete on service and market presence. It would appear that Wall St comes before all else, and this kind of blinkered thinking may very well be how UHC got to this point in the first place.

While the article goes on to report that the CEO, Stephen Hemsley,  says ‘increased benefit buydowns and continued trends of customers migrating to lower-priced plans’ is to blame for the lack of members, he says nothing about its own role in creating an environment where declining membership HAS to be the natural outcome – pricing products beyond the reach of many means fewer people can afford them. Price hikes can only go so high before people begin to forego the product.  Conversely, with fewer members, there are less premium dollars to go ’round, which in turn is bound to affect its Medical Cost Ratios. Unfortunately, this will simply look like medical costs trending ever higher, which isn’t necessarily the case, further bolstering increases to premiums. Except it would appear that the market has finally reached its limit on price. Amen.

Therefore, despite Wellpoint CEO Angela Braly’s assertions that they ‘will not sacrifice profitability for membership’ it looks like United is on the brink of having to do exactly that. I, for one, am looking forward to seeing premium prices come down. 

But the bigger question remains, will United be smart enough to stop dancing to the tune of Wall St and really hunker down and do the work it should have been doing all along, namely, managing the numbers by being an innovative, efficient company rather than just being a profiteer at the expense of employers and providers.  Slashing talent won’t make them a better company, it will only help them meet the next round of numbers. And so the cycle continues . . .

Once the lift from United’s slash-and-burn deflates, you can be sure it will turn to physician reimbursement next unless it figures out in the meantime that the way to ensure sustained profitability – albeit lower than its record-breaking history – is to partner with its stakeholders and get the unnecessary (administrative) costs out of the equation first.

The first glimmer of hope that UHC may be coming to its senses and looking at managing the company rather than the numbers is the fact that its new strategy is focused on ‘balancing the company more in favor of a regional business model’. After years of heavy-handed tactics with newly acquired regional companies to comply with UHC’s one-size-fits-all national uber-structure, this is a big departure from business-as-usual.

Regardless of how it all turns out, hold on to your hats. It’s going to be a bumpy ride.

Never-Events Follow Up

Last January I posted a piece on ‘Never Events’ . In it, I reflected on punitive action versus supportive action. I am therefore very pleased to read in today’s AIS Health Business Daily that the Blues Plans have stepped up to do just that – support better outcomes – by helping hospitals reduce hospital-acquired infections (HAIs) through the use of electronic tools and incentive programs. The plans include Horizon Blue Cross Blue Shield of New Jersey, Blue Shield of California and Excellus Blue Cross and Blue Shield of New York.

The primary tool used is something called the MedMined electronic infection-monitoring system, and is being offered through Cardinal Health, Inc. (a medical and surgical supplies company). That system supplies an electronic tool that monitors all patients in the hospital for infections as well as an on-site trained infection-control specialist. The tool also is tied to the hospital’s financial system, “so you can see how much a patient without an infection costs, compared to what a patient with an infection costs [for the same procedure],” explains Cardinal Health spokesperson Troy Kirkpatrick.

In addition to Cardinal offering grants to hospitals for adopting patient safety products, the Blues health plans will share the costs of the system for the first few years. According to the AIS story, a health plan could cover 60% of system costs in the first year and 40% in the second year, with the hospital paying for the remaining expenses. By the third year, the hospital would pay all system costs, with savings from reducing hospital acqured infections (HAIs) offsetting that expense.

Apparently, the MedMined tools helped reduce overall HAIs by 3.2% at pilot hospitals in 2007, according to an issue brief from the Blue Shield of California Foundation. That organization has already spent $5 million on the initiative and is working with California’s Healthcare-Associated Infection Prevention Initiative (CHAIPI) to reduce HAIs through MedMined and also through a “learning collaborative” effort among participating hospitals. “Among CHAIPI hospitals, reductions in HAIs resulted in 4,641 fewer hospital days and $2,163,437 in bottom-line savings.…In all, the initial investment in CHAIPI has generated a minimum five-fold return in costs avoided, for a total of more than $9 million” over a period of 18 months, according to the foundation.

This is a very positive development and illustrates how collaborative efforts, rather than puntive ones, can not only help advance medicine and safety but systematically decrease costs for everyone.

Kudos to the Blues for leading the way on this and for taking a stake in securing better outcomes.

Tipping Point for Insurers?

Has the tipping point regarding profitability versus viability finally come? Fed up with escalating premiums, employer groups appear to be aggressively shopping around, and in many cases dropping coverage for their employees altogether.

Today the New York Times reported that shares of WellPoint plummeted more than 16 percent in after-hours trading Monday after the company lowered its profit forecast, citing higher medical costs and lower-than-expected insurance enrollments. Humana and Aetna shares dropped 10% and United dropped 9% following this outcome. 

With the shift by employer groups to self-funded plans (meaning insurers simply pass along the costs of employee health costs with an administrative fee to the employer) and with more individuals becoming responsible for finding and funding insurance coverage for themselves, enrollment is not what it used to be in the large insurer market.

According to Sheryl Skolnick, a health care analyst with CRT Capital in Stamford, Conn., and quoted in the NYT article, with regard to insurance premiums, “prices are higher than people feel they are able to afford,” especially for individuals who buy their own insurance because they do not have coverage from an employer.

So, have insurers premiums finally reached the tipping point where their prices are too high to be sustainable? I believe so. And until these companies start offering products such as catastrophic insurance (without requiring a separate managed care plan) and lower priced, appropriately managed, affordable plans I don’t think this will turn around any day soon.

The good news? Perhaps this will reduce the trend of physician reimbursement gouging that has been sustaining profits and begin to put the emphasis on insurers’ operational efficiency to drive excess dollars in the future. And no, that doesn’t mean insurers should further cut their customer service staff and cut back on the resources necessary to manage all of the myriad and convuluted processes that these companies have built up over time. Rather, a focus on lean and efficient simplified processing, less complexity in medical and administrative policy making, and more accountability that leads to partnering with the other stakeholders in health care might be the way forward for these behemoths.  Or, they can simply lumber along and wait for the market to finally, finally!, correct for the abuses of the past.

When Profit equals Improved Service (shouldn’t it be the other way ’round?)

The Wall Street Journal reports “UnitedHealth reported a 3.5% rise in quarterly net income, as the health-insurance giant benefited from strong growth in its prescription-solutions unit”.

From what we have seen through our tracking of policies, ‘prescription-solutions’ means drug pre-authorizations, tiering and other administrative hurdles that have been added to the cost of running practices. Physicians carry the administrative cost, UHC profits. Nice, right?

If you read the article, you’ll note that there is much talk about United’s improved service, yet the member numbers don’t hold up. Maybe you’ll be as confused as I am when you read Mr. Helmsley’s comment “Our service levels have recovered strongly”, followed by ‘UnitedHealth continues to expect a 2%, or about 550,000-member, decline in commercial enrollment in the first quarter’ and ‘the outlook for the decline in risk-based commercial members is now closer to 400,000 than to 350,000, Mr. Hemsley said.

Furthermore, the article goes on to state ‘In the fourth quarter, UnitedHealth saw a 75,000-member decline sequentially in commercial risk-based membership and a 480,000-member decline year over year. Total commercial enrollment was flat sequentially at nearly 25.53 million and down 175,000 year over year, as fee-based commercial membership increased’.

Let’s see: decline in enrollement + increased profits = improved service. Yep, that makes perfect sense alright.  

I don’t see a quantification of HOW service levels have improved, other than discussion of PROFIT as an indicator. But as anyone who has studied statistics will know, correlation does not equal causation.

Looks to me like UHC are equating improved dollars to improved service, regardless of declining enrollment. How can that be? Wouldn’t it be the other way ’round, that improved service would mean an increase in enrollment? Perhaps service is the least of what is feeding the bottom line numbers. In addtion to the stated ‘prescription-solutions’, SEC filings suggest that acquisitions, policy change initiatives and lack of claims payments are all helping to boost the bottom line. That has nothing to do with improvements.

So what I want to know is, when is a journalist going ask “What have you actually done to improve SERVICE?”

Never-Events

Private health insurers have jumped on the band wagon when it comes to not paying for preventable injury or illness occuring through hospital errors. Medicare instituted non-payment of errors last October.

Aetna, Wellpoint, and some other large insurers are starting with a shorter list than Medicare’s so-called ‘never-event’ list. Primarily focused on the most egregious errors such as bed sores, falls and hospital infections, the list could expand quickly as these initiatives are implemented.

The idea is that insurers will no longer pay for mistakes, and hospitals cannot bill patients directly for the cost of care associated with fixing these problems, in an attempt to improve patient safety. But is that going to be the outcome? What about the patient who, say, has a sponge left inside after an operation? Will a procedure be performed gratis to remove it, or will it simply be left there instead?

If insurers are truly seeking to improve safety and lower the overall costs of care, it strikes me that responding punitively is not the right answer. Rather, why not help support safety by paying for screenings that help identify MRSA in patients coming in to the hospital, and reward those hospitals that have significantly fewer errors over time.

Indeed, every effort should be made to prevent errors in the first place, so shouldn’t the focus be on paying for preventive measures rather than on not paying for fixes when they occur?

Otherwise, this will just become another reason for insurers to not pay for needed care which will cycle through the system adding more expense elswhere. Meanwhile patient welfare may be compromised when things go wrong, which can only exacerbate the problem going forward.